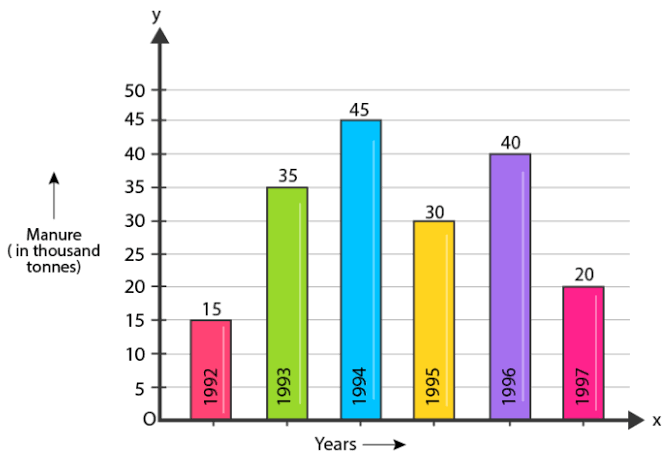
Data Handling in Mathematics refers to the collection, organization, representation, and interpretation of data in various forms. It helps to summarize and make sense of large amounts of information, allowing us to make informed decisions based on statistical analysis.
Here’s a detailed breakdown of data handling in mathematics:
1. Data Collection
Data collection is the first step in data handling. It involves gathering information from various sources. This data can be:
- Primary Data: Collected directly from the source (e.g., surveys, experiments).
- Secondary Data: Collected from existing sources (e.g., research papers, government reports).
2. Data Organization
Once data is collected, it needs to be organized. This makes it easier to analyze. Some common methods of organizing data are:
- Tables: A table lists data in rows and columns. Each row may represent an individual data point, while columns represent different variables.
- Frequency Distribution: A table that shows how often each value or range of values appears in a data set. Example: Data Frequency 1 3 2 5 3 2 4 4
- Class Intervals: In case of continuous data, data is grouped into intervals (e.g., 0–10, 10–20, etc.). This is especially useful for large datasets.
3. Data Representation

Data can be represented visually using graphs and charts to identify trends, patterns, and relationships easily. Some common types of graphical representations are:
- Bar Graphs: Used for categorical data, where the height of each bar represents the frequency of the category.
- Histograms: Similar to bar graphs but used for continuous data that has been grouped into intervals (class intervals).
- Pie Charts: Represent parts of a whole in the form of slices of a circle.
- Line Graphs: Useful for showing trends over time, where data points are connected by lines.
- Pictographs: Use pictures or symbols to represent data visually.
- Stem-and-Leaf Plots: Provide a way to organize numerical data to show the shape of the data.
4. Data Analysis
Once the data is organized and represented, the next step is to analyze it using various statistical methods. Key steps in data analysis include:
- Measures of Central Tendency:
- Mean (Average): Sum of all data points divided by the number of data points.
- Median: The middle value when data is arranged in ascending or descending order. If there’s an even number of data points, the median is the average of the two middle values.
- Mode: The value that appears most frequently in a dataset.
- Measures of Dispersion:
- Range: The difference between the highest and lowest values in the data set.
- Variance: The average squared deviation of each number from the mean.
- Standard Deviation: The square root of the variance, showing the spread or dispersion of the data.
5. Interpretation of Data
Data interpretation involves making conclusions based on the data analysis. For example, you might interpret trends or patterns in a line graph, compare the central tendencies in a dataset, or assess the variability through the standard deviation.
6. Probability and Data Handling
In some cases, data handling extends to probability theory, where you assess the likelihood of different outcomes based on the data. This helps in predictions and decision-making processes.
For instance, if you know that 60% of the students in a class are boys, you can predict that a randomly selected student is more likely to be a boy than a girl.
7. Data Handling in Real-life Applications
Data handling is widely used in real-life scenarios, such as:
- Business: Analyzing customer feedback, sales data, or market trends.
- Health: Analyzing patient records, disease patterns, or drug efficacy.
- Sports: Analyzing player performance, game statistics, etc.
- Education: Analyzing student performance and learning patterns.
Conclusion
In mathematics, data handling is an essential process for understanding and analyzing information in an organized and meaningful way. By collecting, organizing, representing, analyzing, and interpreting data, we can make well-informed decisions across various fields.

Leave a Reply